From the visual builder to PDF export, every feature connects to a single source of truth.
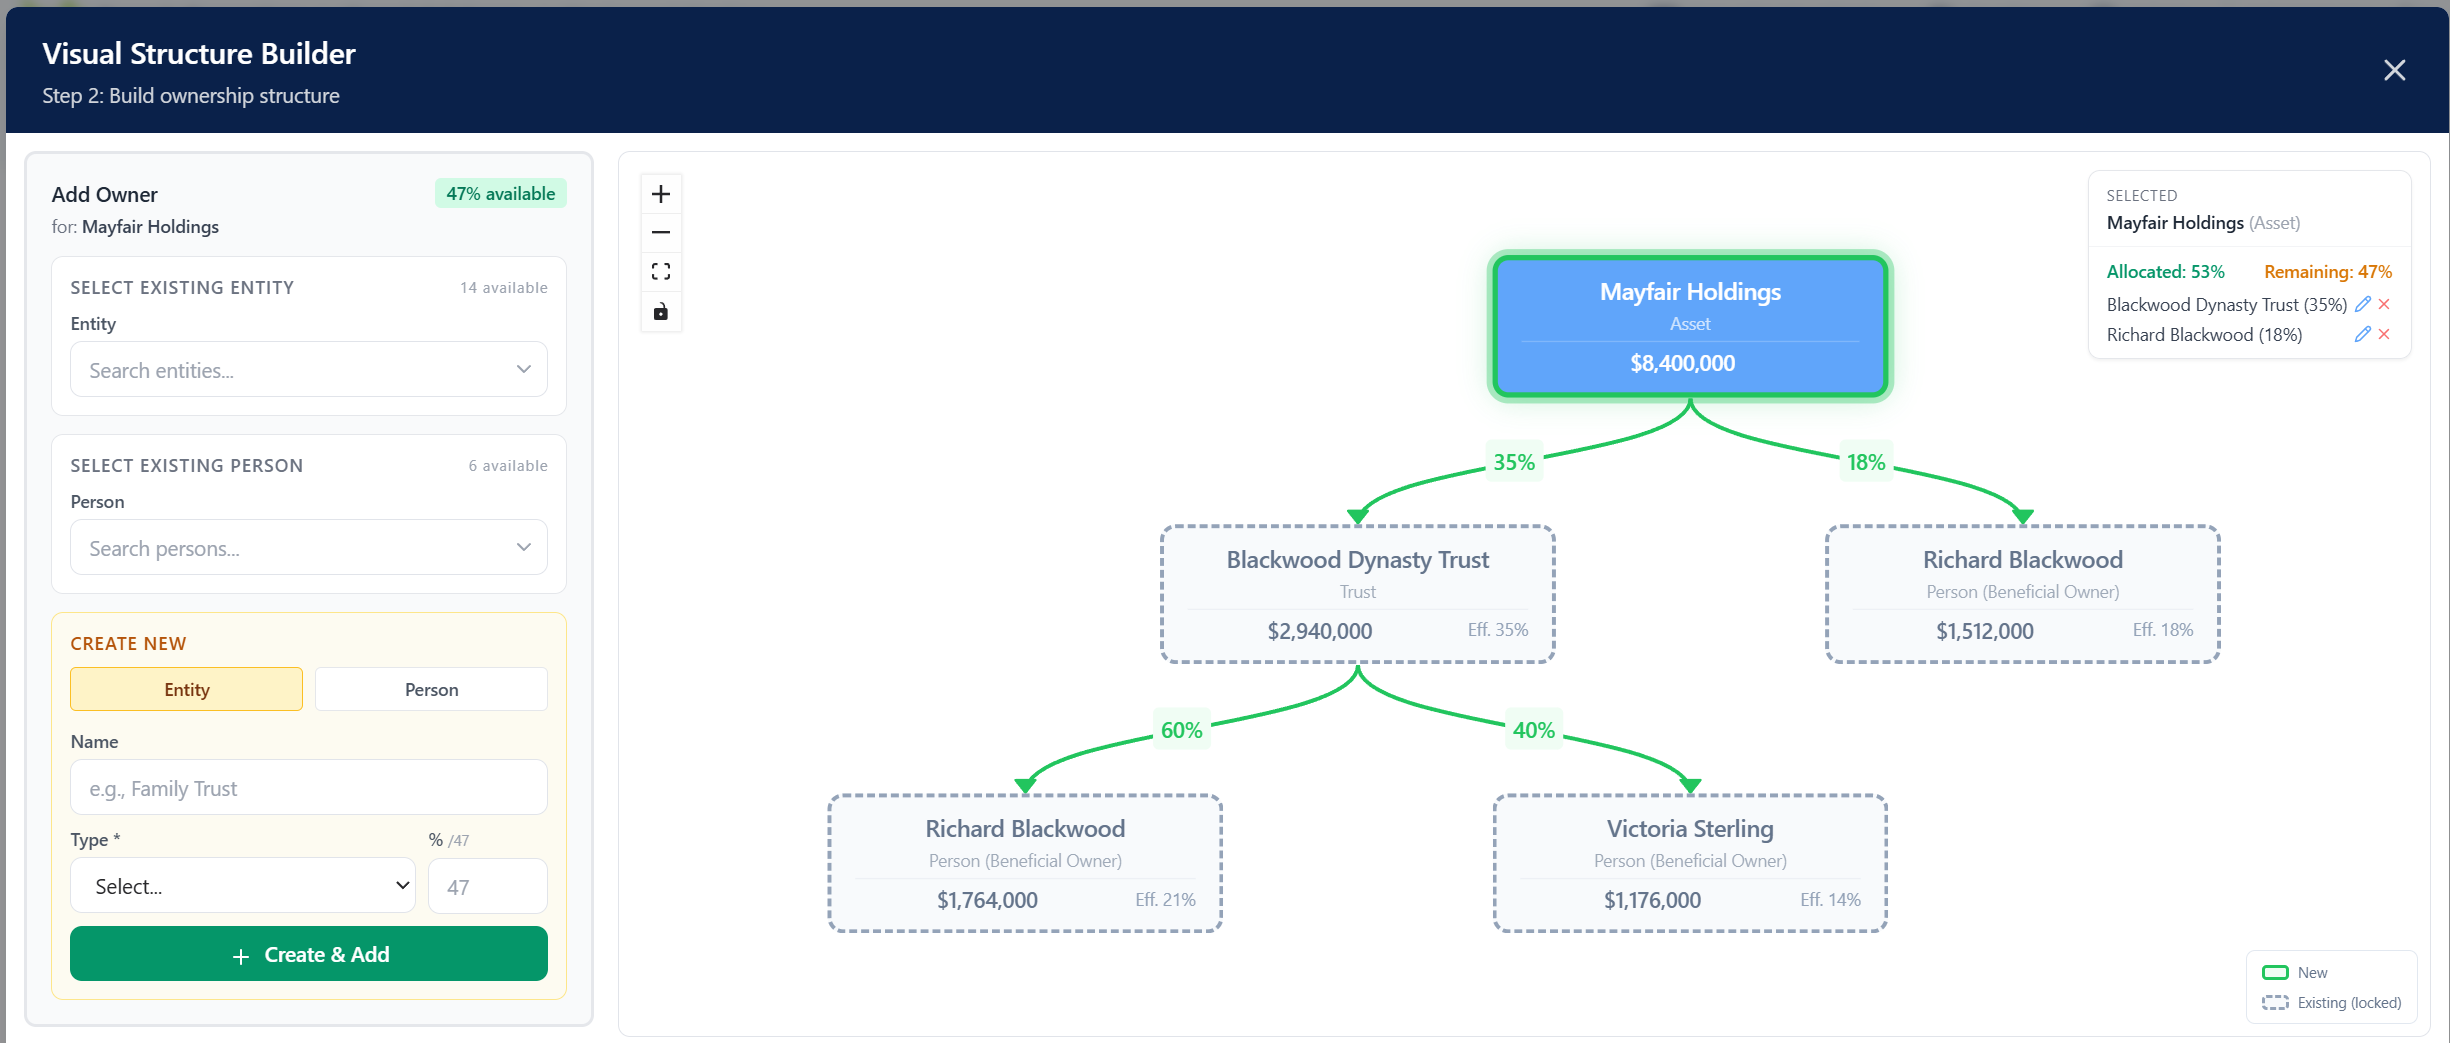
Build ownership chains through a guided wizard. Controls on the left, a live diagram on the right. Click any node, add owners from the family’s existing entity pool or create new ones on the spot, and set ownership percentages. The diagram updates as you build — no separate drawing step.
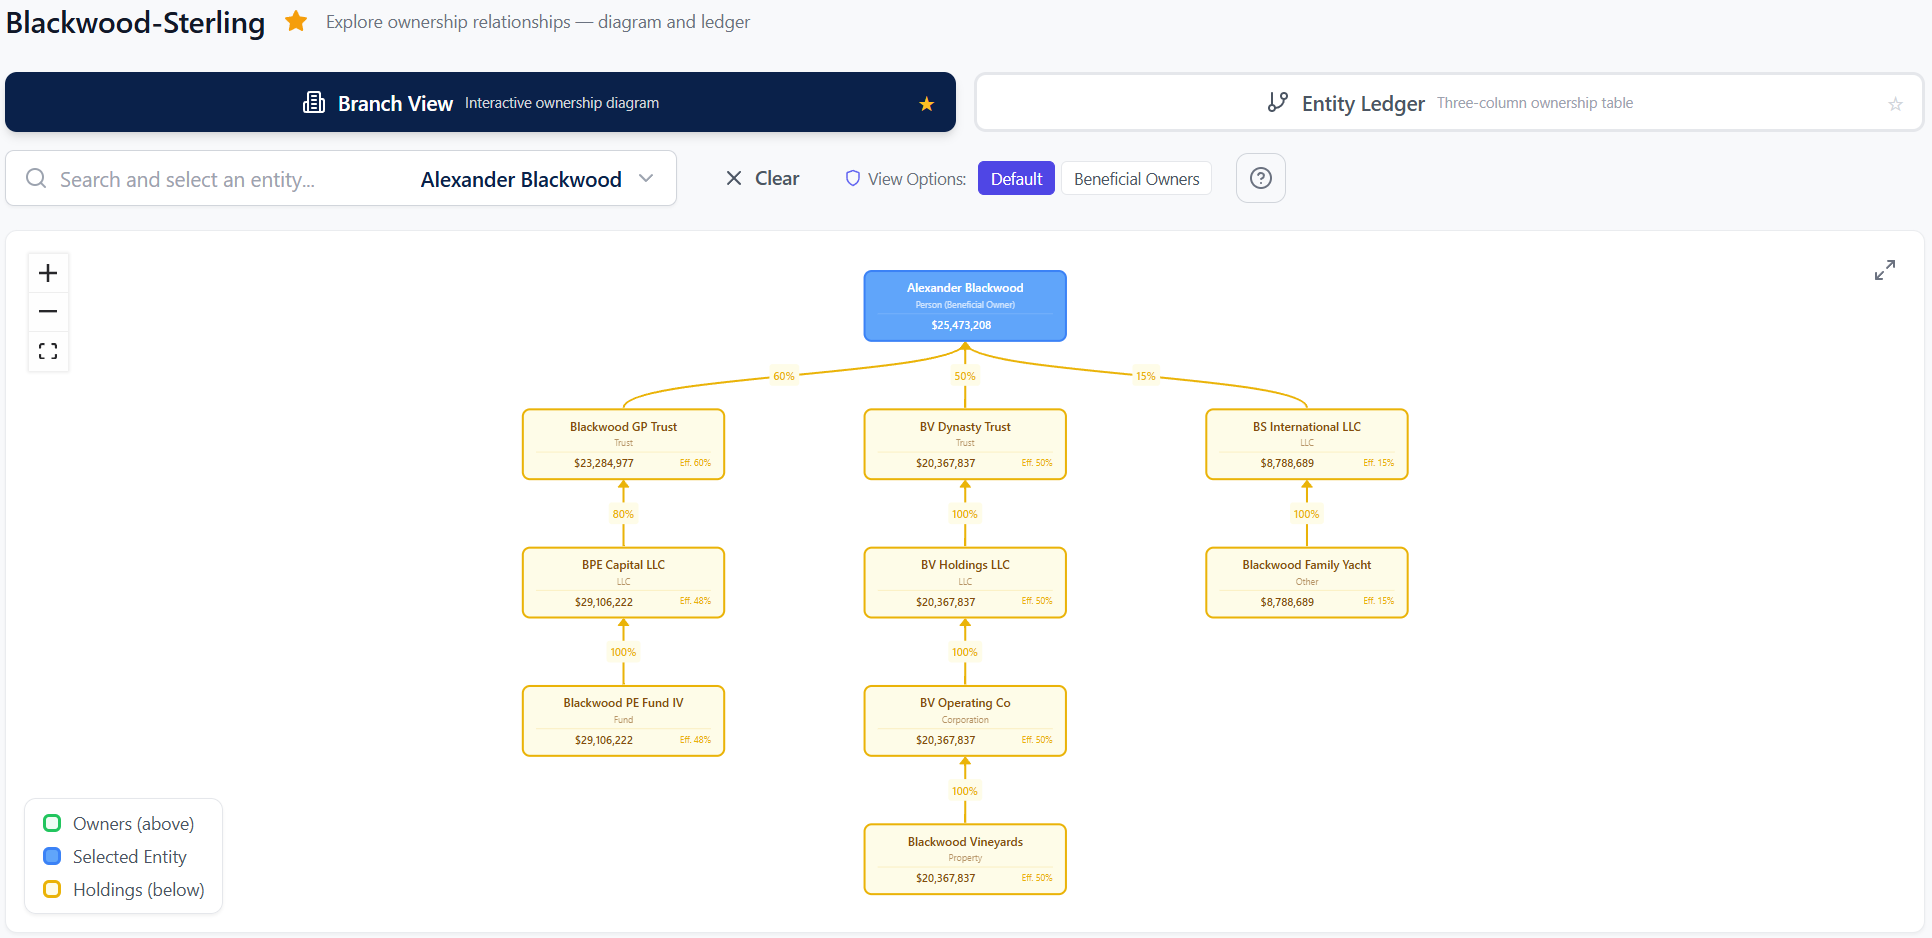
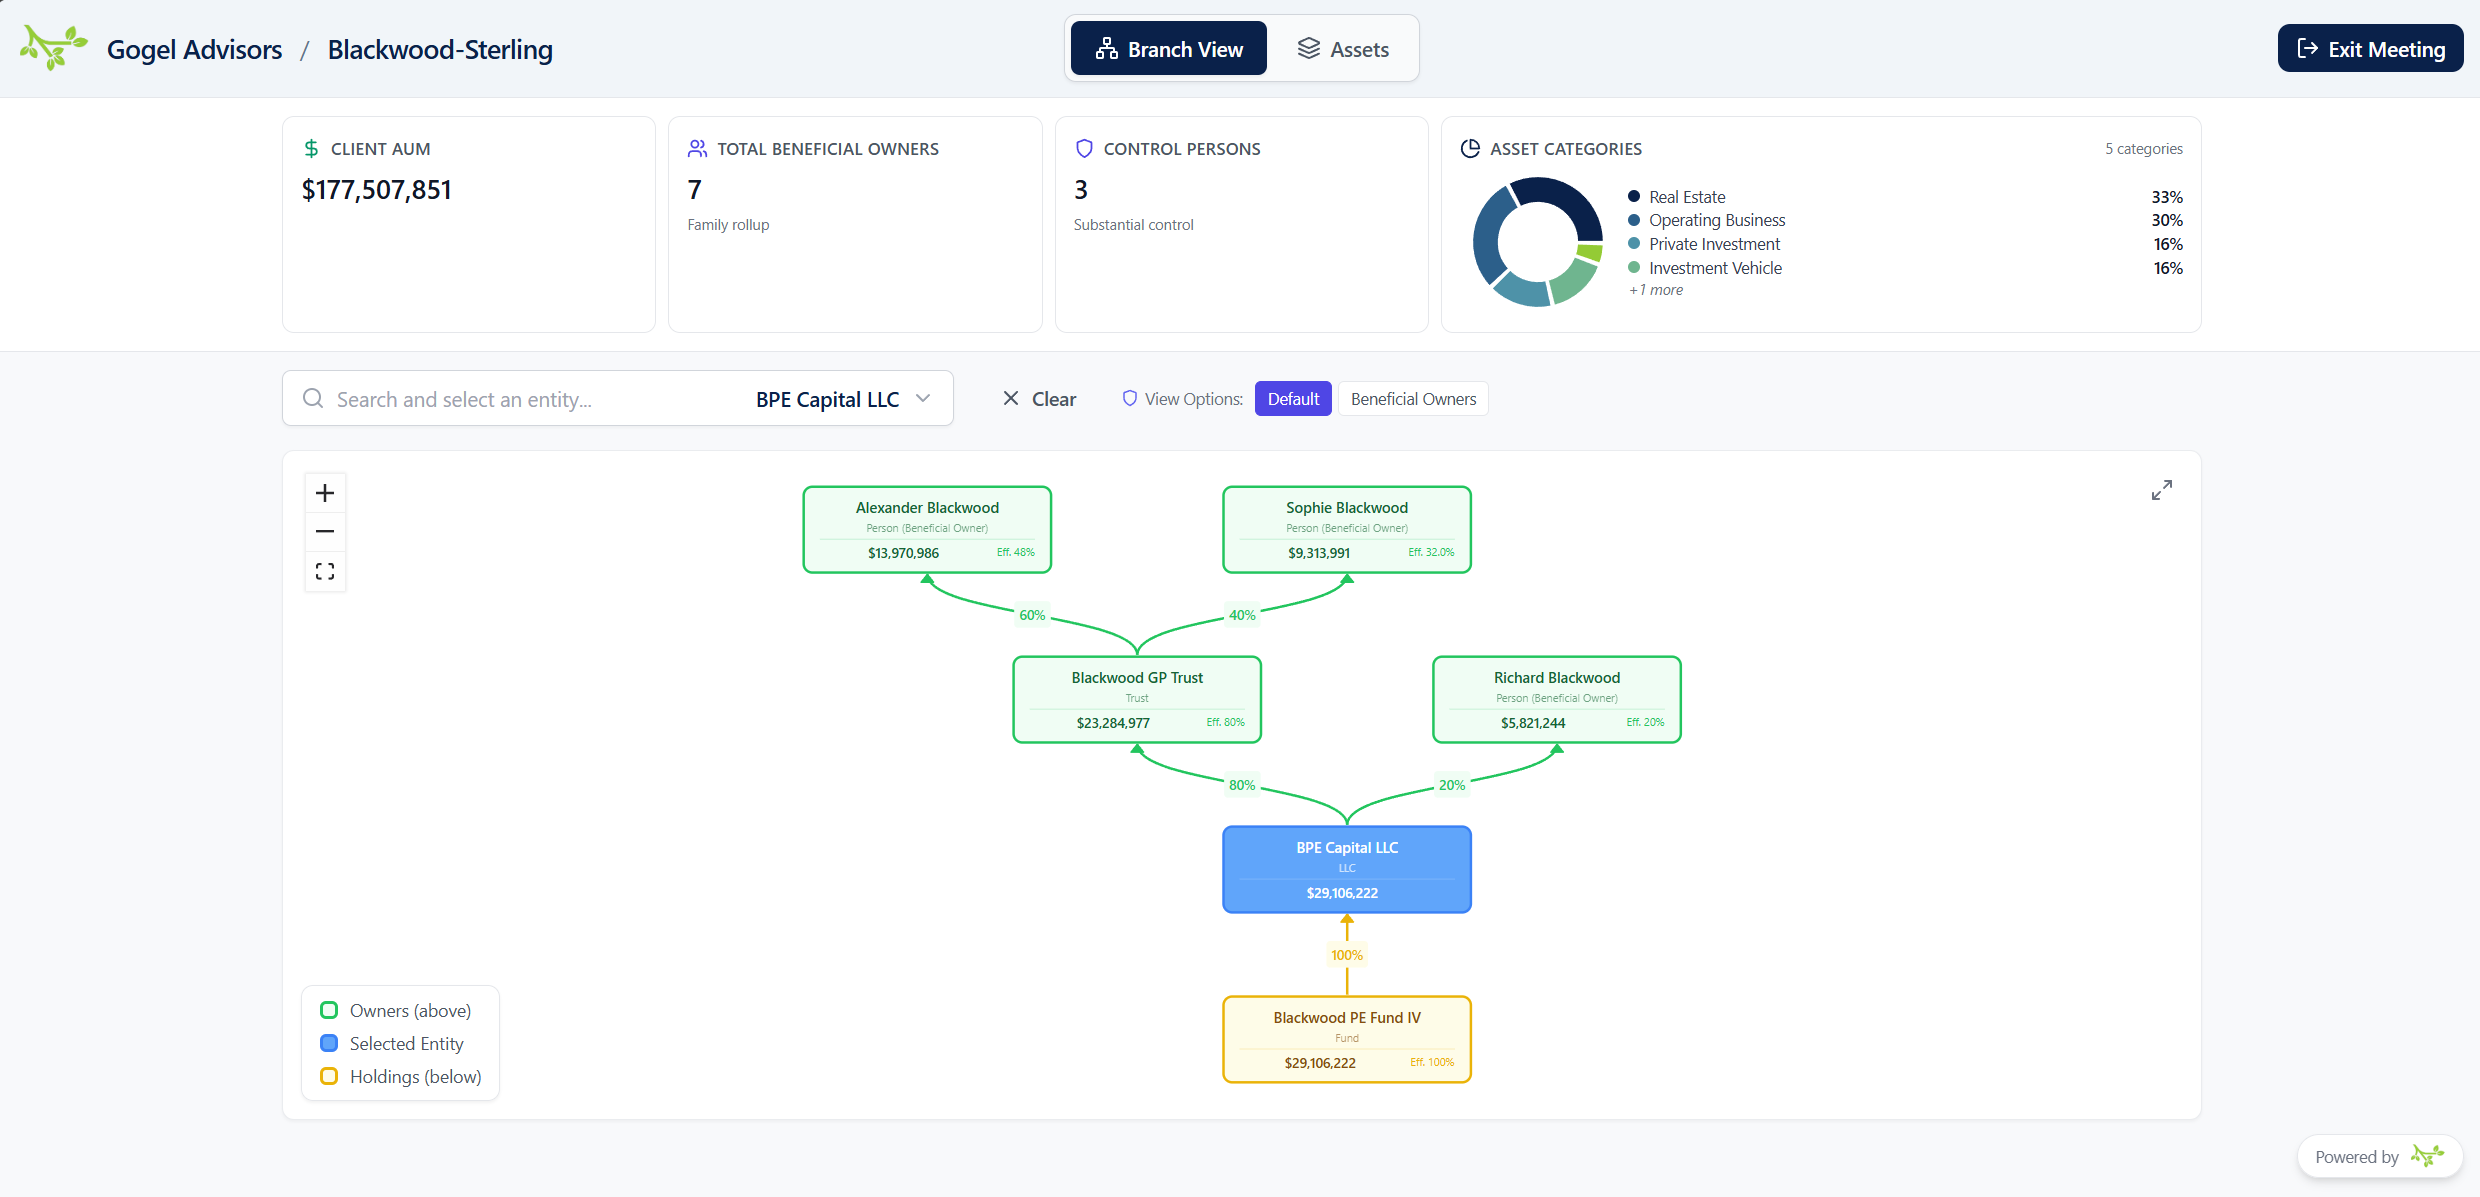
Explore the entire ownership web from any starting point. The Entity Ledger shows a clear audit table: who owns an entity, and what it owns. The Branch View lets you pick any entity and see its full ownership context — who’s above it, what’s below it — with effective percentages calculated automatically.
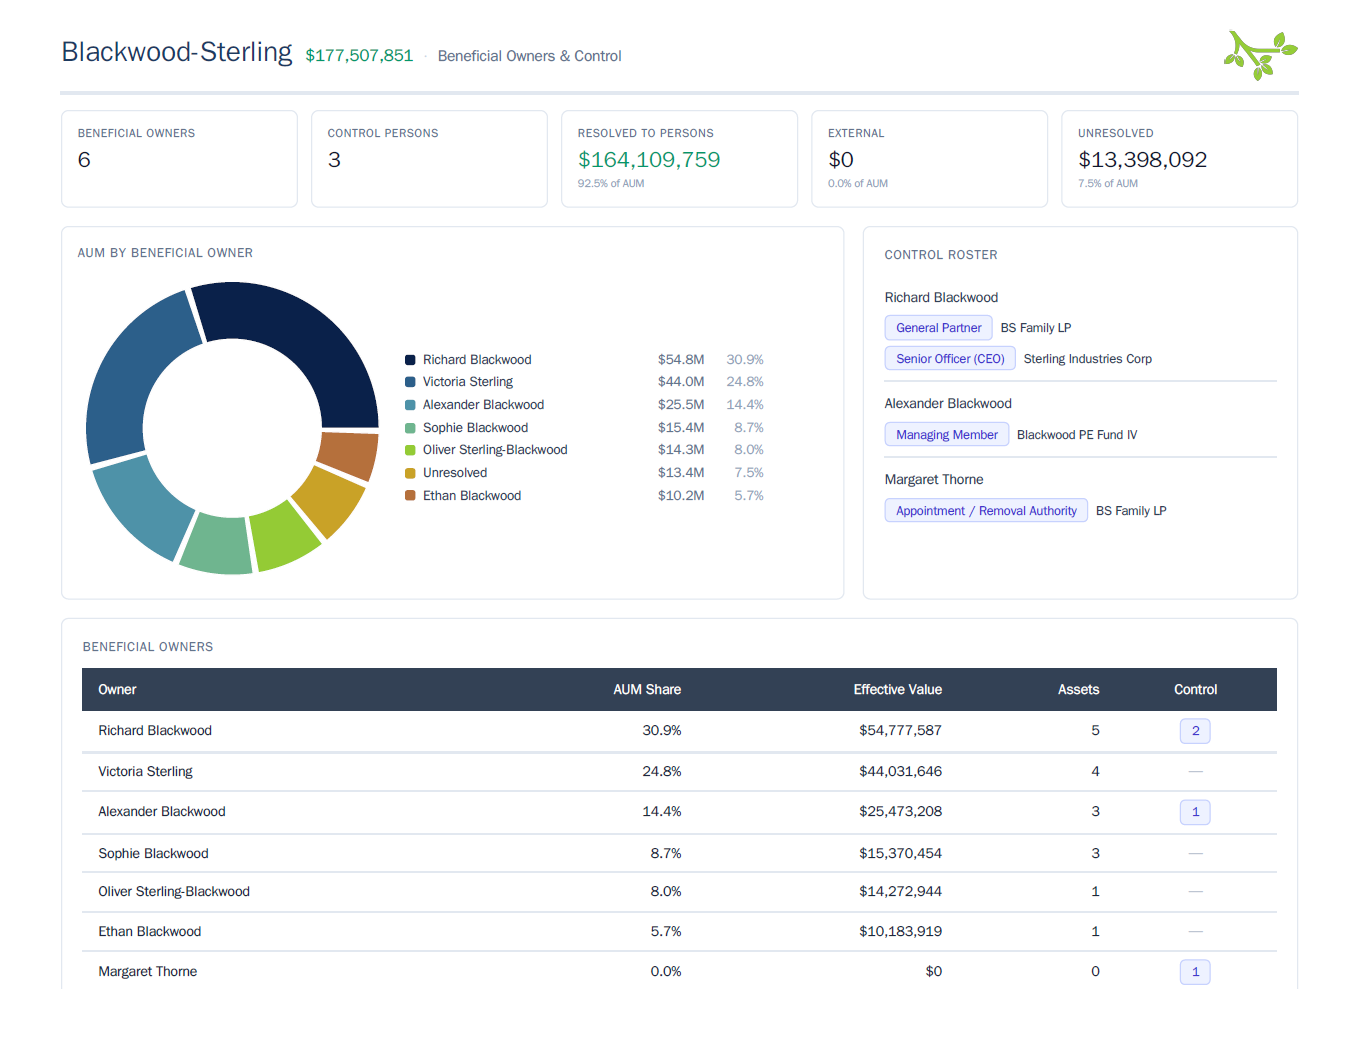
For every asset, the Beneficial Owners panel lists each natural person who ultimately owns a piece of it. Effective percentages roll up through every layer of structure. Common thresholds — 5%, 10%, 20%, and 25% — are one click away. The same roster aggregates to a family-wide view so you can answer “what does this person own across the whole book?” in one place.
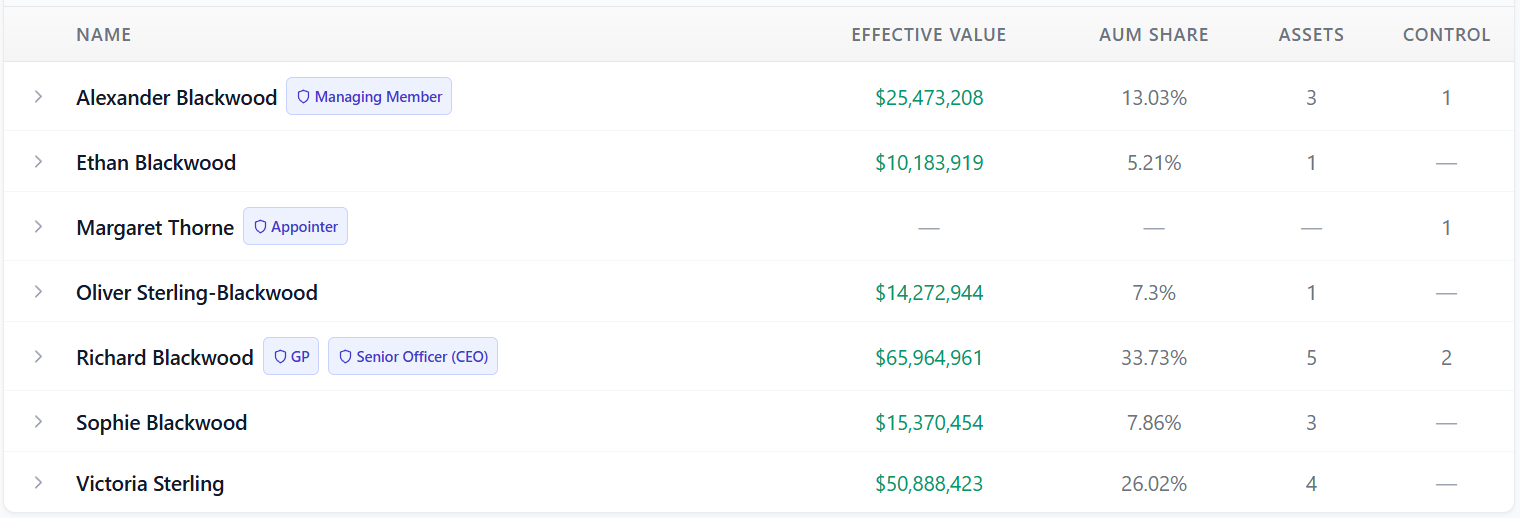
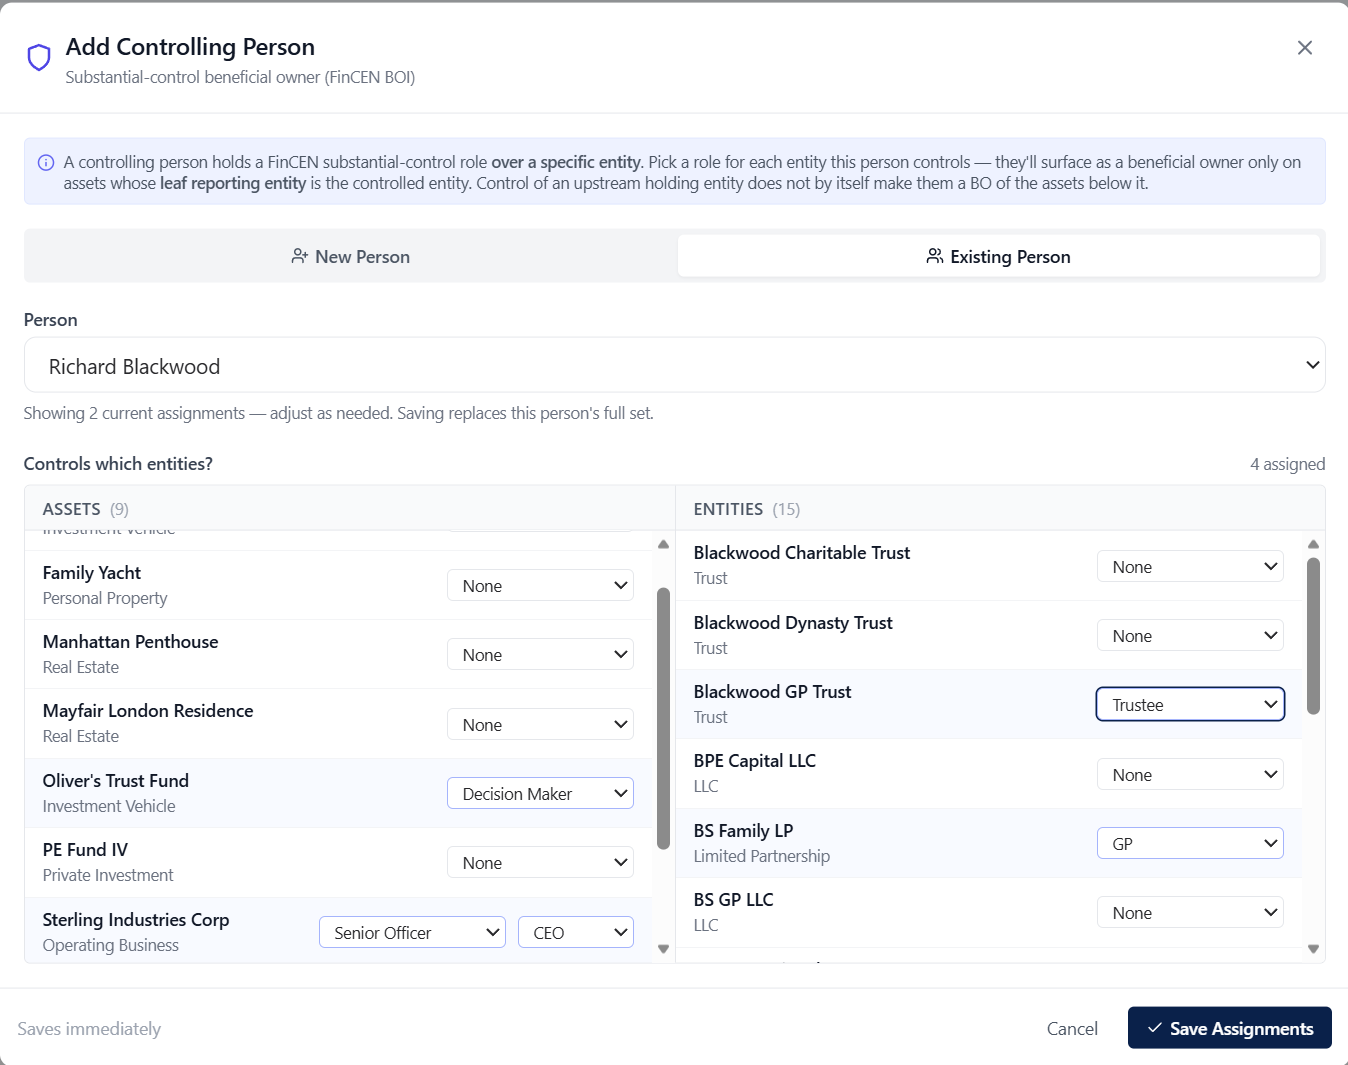
Ownership percentage is only half the story. Branch Reporting tracks control through named roles tied to the specific entities they govern — in the same data model as the ownership math, surfaced on the same beneficial-owners roster. A 0%-equity controller (an outside director, a trustee, an appointer) never gets silently dropped, and a senior officer’s title carries through to the report.
A curated view of the platform itself, branded with your firm’s logo — with the same controls your team uses internally, so no one has to learn a second system.
The other format. Export any structure as a polished, presentation-ready PDF — same diagrams, same tables, same calculated values as the dashboard the team uses in Meeting Mode. Your firm’s logo, custom titles, and disclosure footers on every page. Bundle assets together as a saved report group, or bundle people for recurring beneficial-owner rollups. Use them wherever the team’s regular client reporting cadence already lives.
The third format. Your team picks which owners get access; each client signs into a portal branded as your firm and sees a live, read-only view of what they own — holdings, values, income, and their own slice of the ownership structure. Same data that drives your meetings and PDFs, available to them any day of the quarter.

Every login, every valuation change, every ownership edit is logged with the actor, the timestamp, the IP, and a human-readable description. Searchable by date range, by action, by user. CSV export. The trail is there if you ever need to walk it.
The date a number represents (the statement date) is different from the date it landed in the system. Branch Reporting tracks both, displays both, and flags stale valuations so you know what’s fresh and what isn’t before you walk into a meeting.
Paste a column of dates + values from the latest statement set. The platform parses, validates, and writes them in one shot. The cards turn green when everything’s accounted for.
Onboarding a family with sixty entities? Paste the list, pick a type per row, import. Same UX as bulk valuations. No file format to learn, no template to download.
Thirty minutes, on a video call. Bring a real ownership chain — we’ll model it live and show what the PDF looks like at the end.