For wealth advisors, family offices, and estate planners. One structured dataset covers every ownership chain and every controller — driving your client meetings, your branded PDF reports, and a client portal for the days in between.
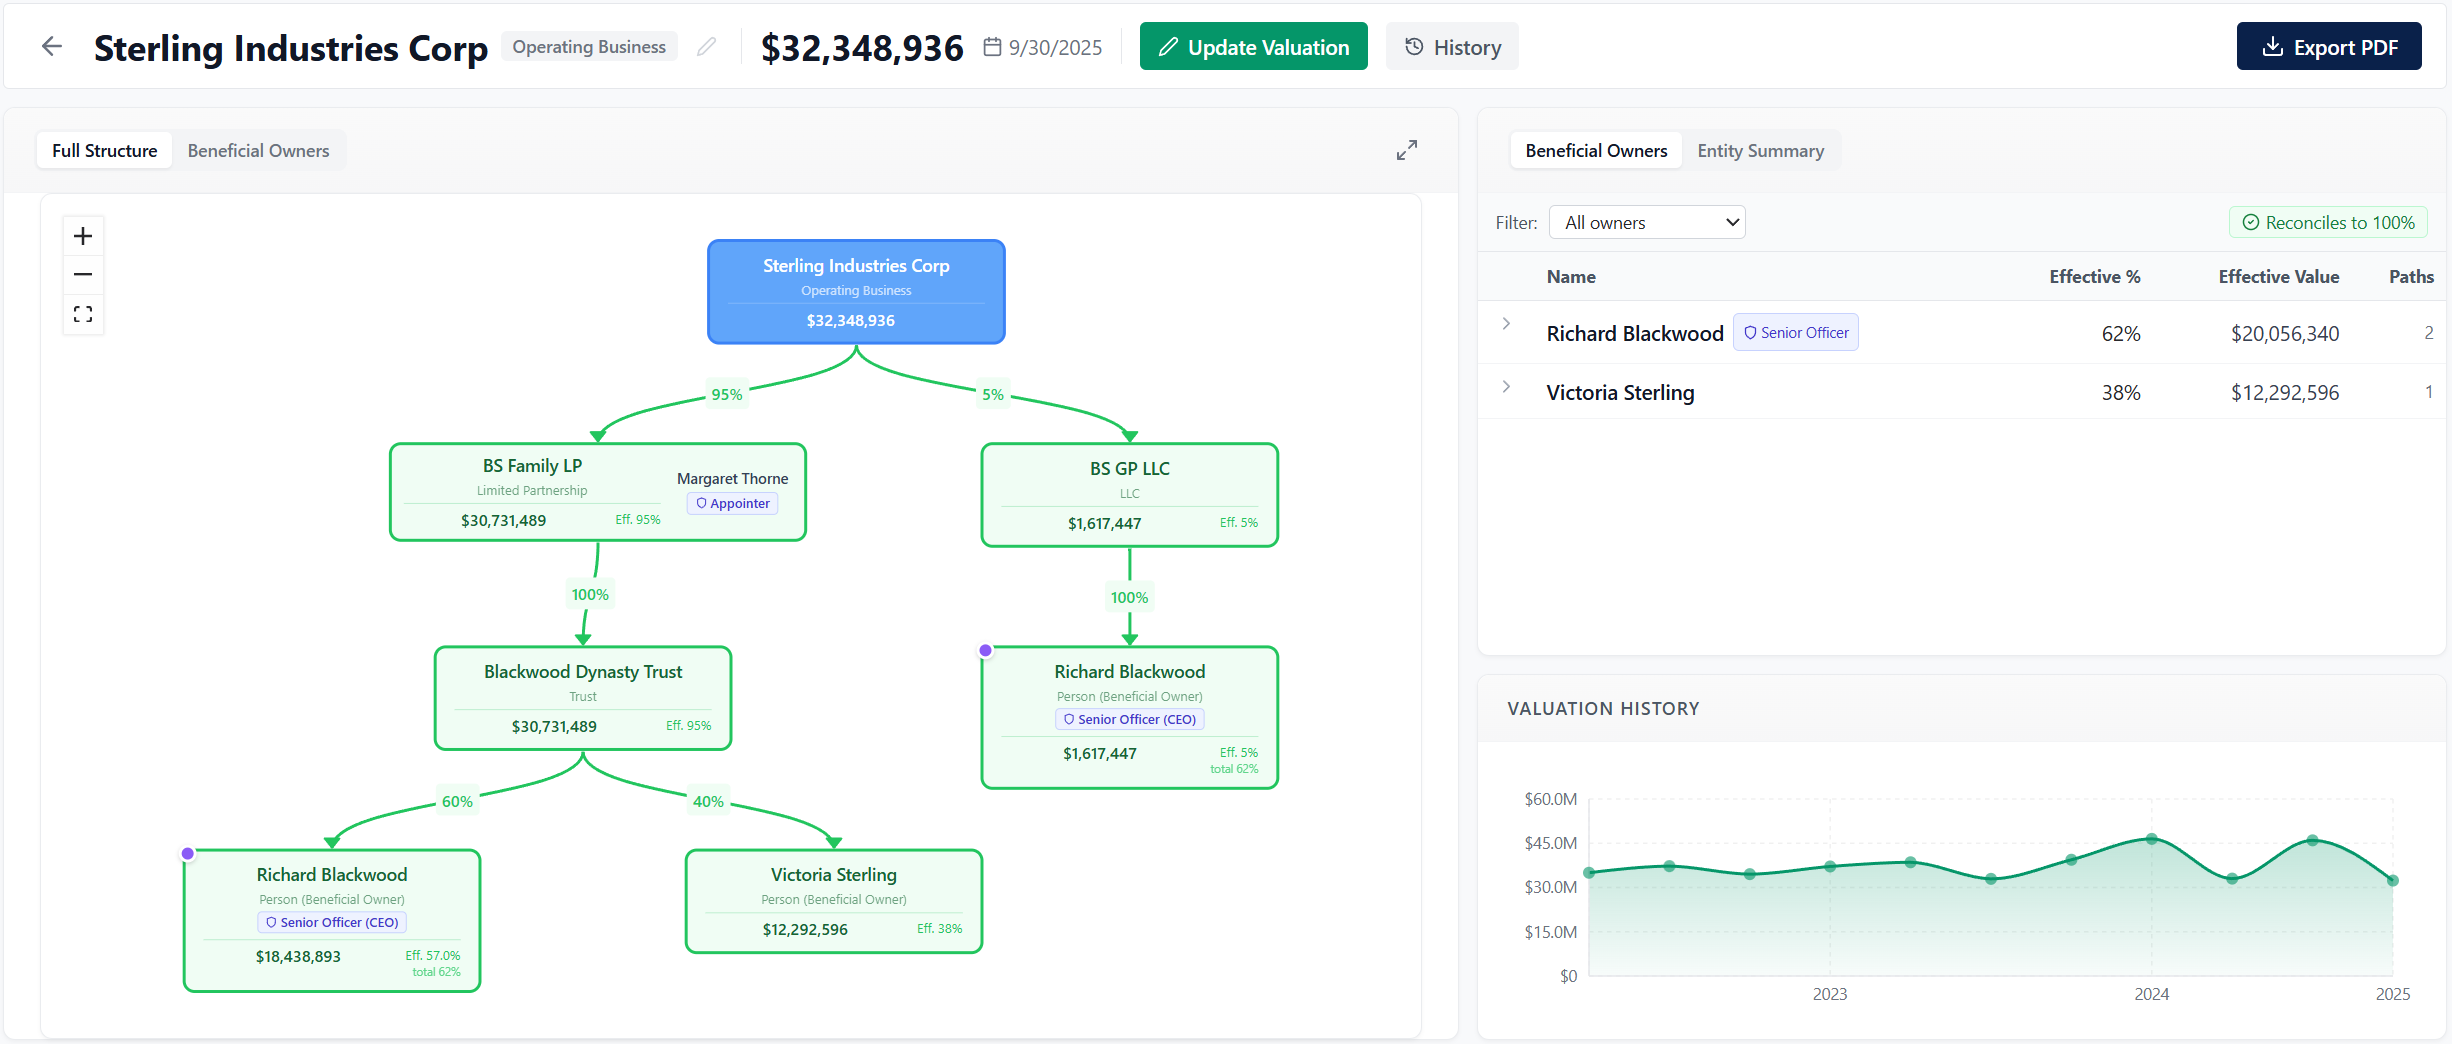
Open any asset and see the whole picture: the ownership diagram on the left, the beneficial-owners roster on the right. Every value attributed at every node. Every natural person who ultimately holds a piece, with effective percentages rolled up through every layer of trust, LLC, and holding company.
Built around the ownership graph — not bolted on top of a spreadsheet.
Set up a family’s entity structure once. Every new asset connects to the same trusts, LLCs, and people — the more assets you add, the more time you save.
The ownership engine walks every chain and computes attributed values at every node. Update one valuation and everything downstream updates instantly.
Meeting Mode for live client reviews on screen. Branded PDF reports for the regular reporting the team already does. A client portal for owners between meetings. All three come from the same live data — replacing the spreadsheet-to-slide-deck cycle quarterly reviews used to require.
Multi-path ownership rolls up to a single line per person — no double-counting. External owners sit in their own bucket, never quietly lumped with “unresolved.” Math that holds up to inspection.
The entity structure is the foundation. Assets plug into it — not the other way around.
Define the people, trusts, LLCs, and partnerships once — reuse them across every asset.
Connect new assets to entities that already exist. Set the percentages. The diagram builds itself in real time.
Change a valuation once; every attributed value downstream recalculates. Present in Meeting Mode, then send the branded PDF for the rest of client reporting.
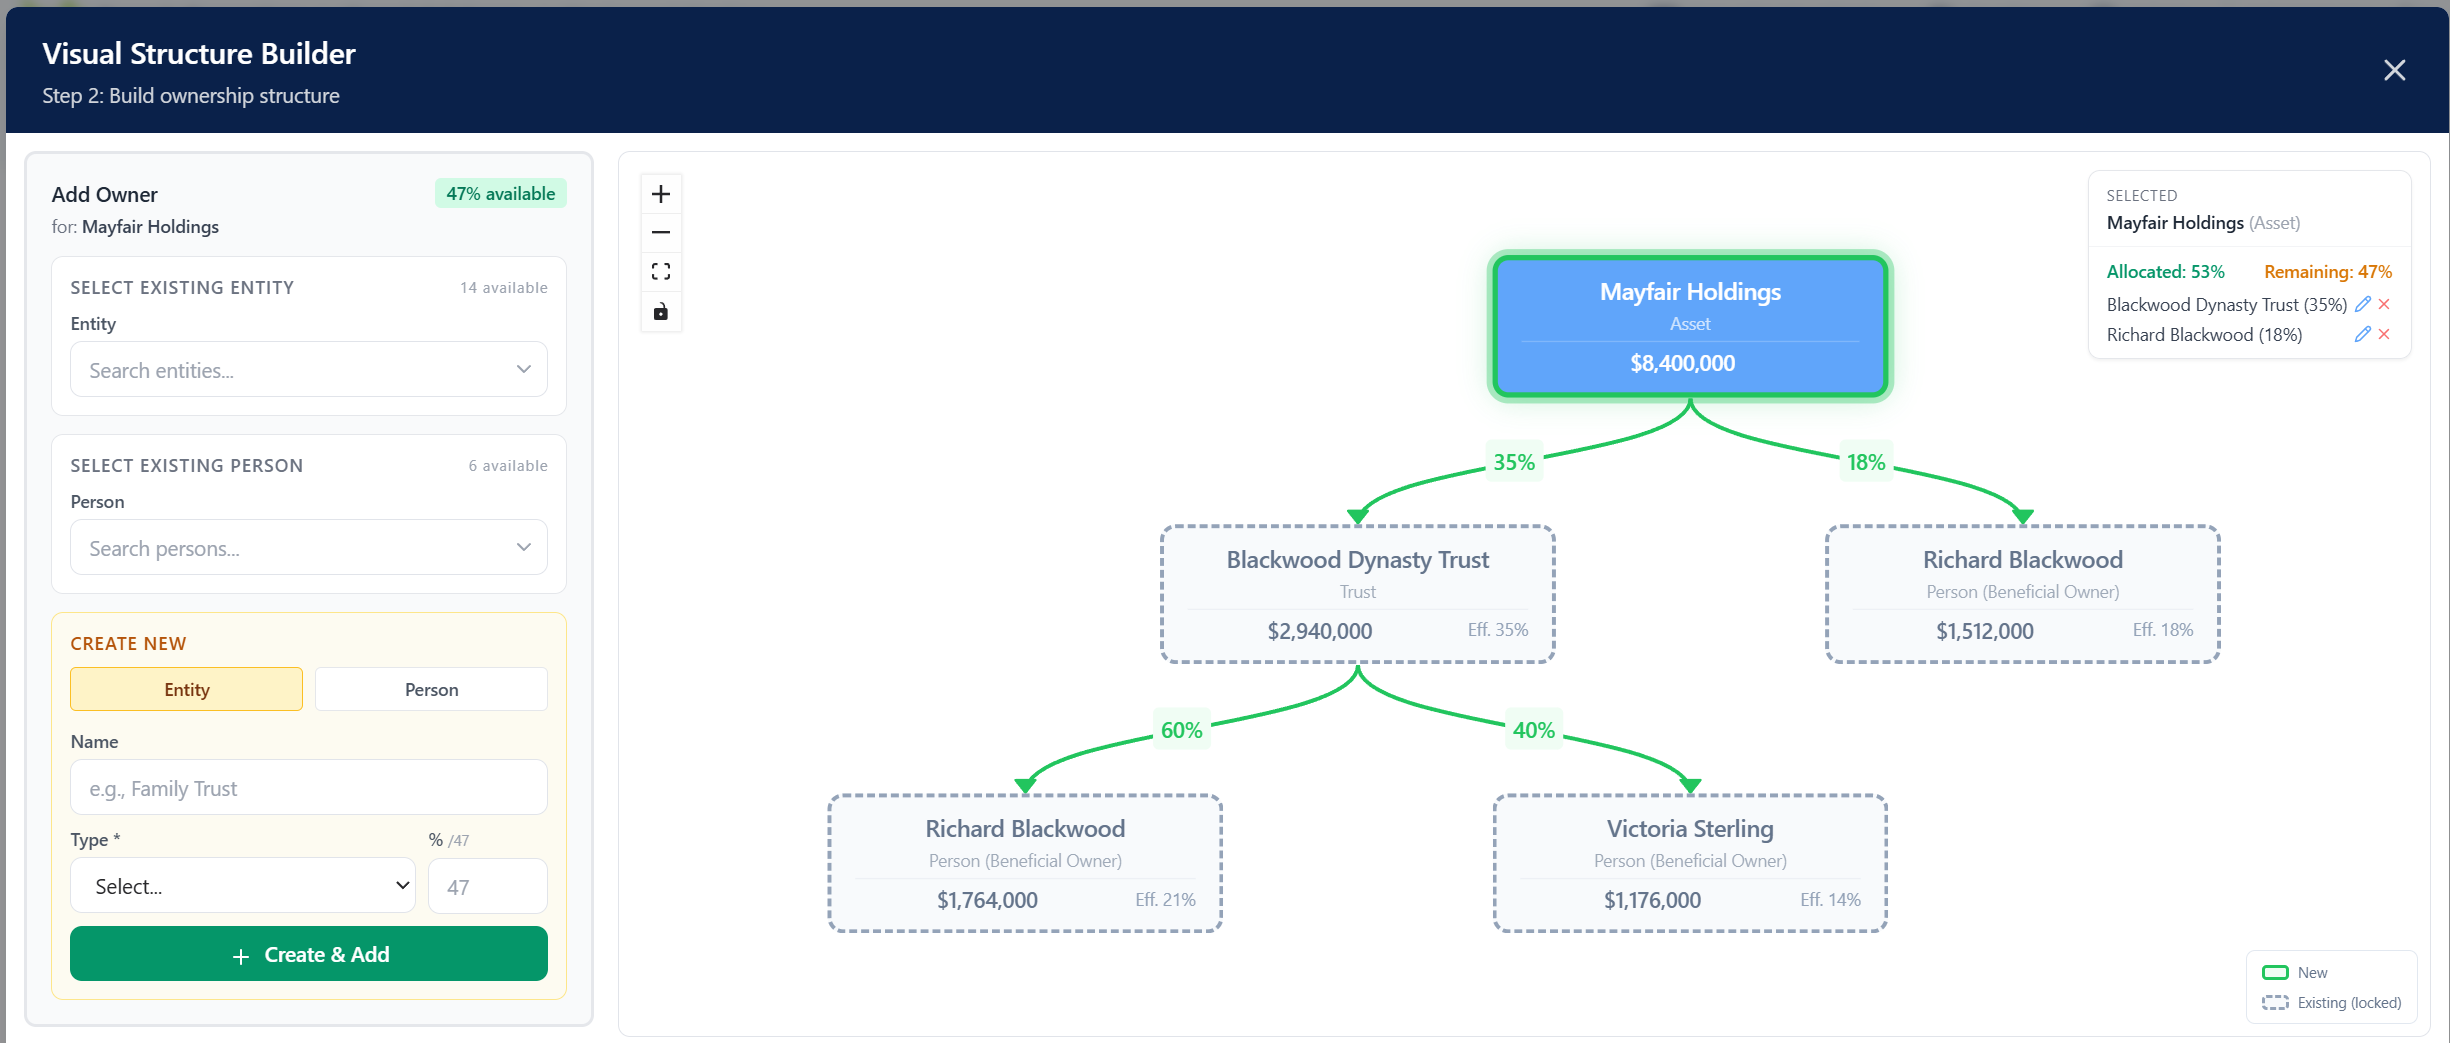
A family with 20 assets might have only three underlying trusts. In a spreadsheet workflow, that’s 20 separate documents to keep in sync — every quarterly valuation, every ownership change, every trustee swap. Branch Reporting maintains the structure once. Every report downstream reflects every change automatically.
The same trusts, LLCs, and family members own dozens of things. Maintain the structure once — every asset connects to it instead of duplicating it.
Change a valuation, a trustee, or an ownership split. Every report that touches that entity updates instantly — no hunting through twenty documents by hand.
Pulling values, redrawing diagrams, re-keying numbers into slide decks — multiplied by every family, every quarter. That work collapses into minutes.
Every offering reads from the same live ownership graph — nothing gets exported, re-keyed, or allowed to drift.
Live · in the room
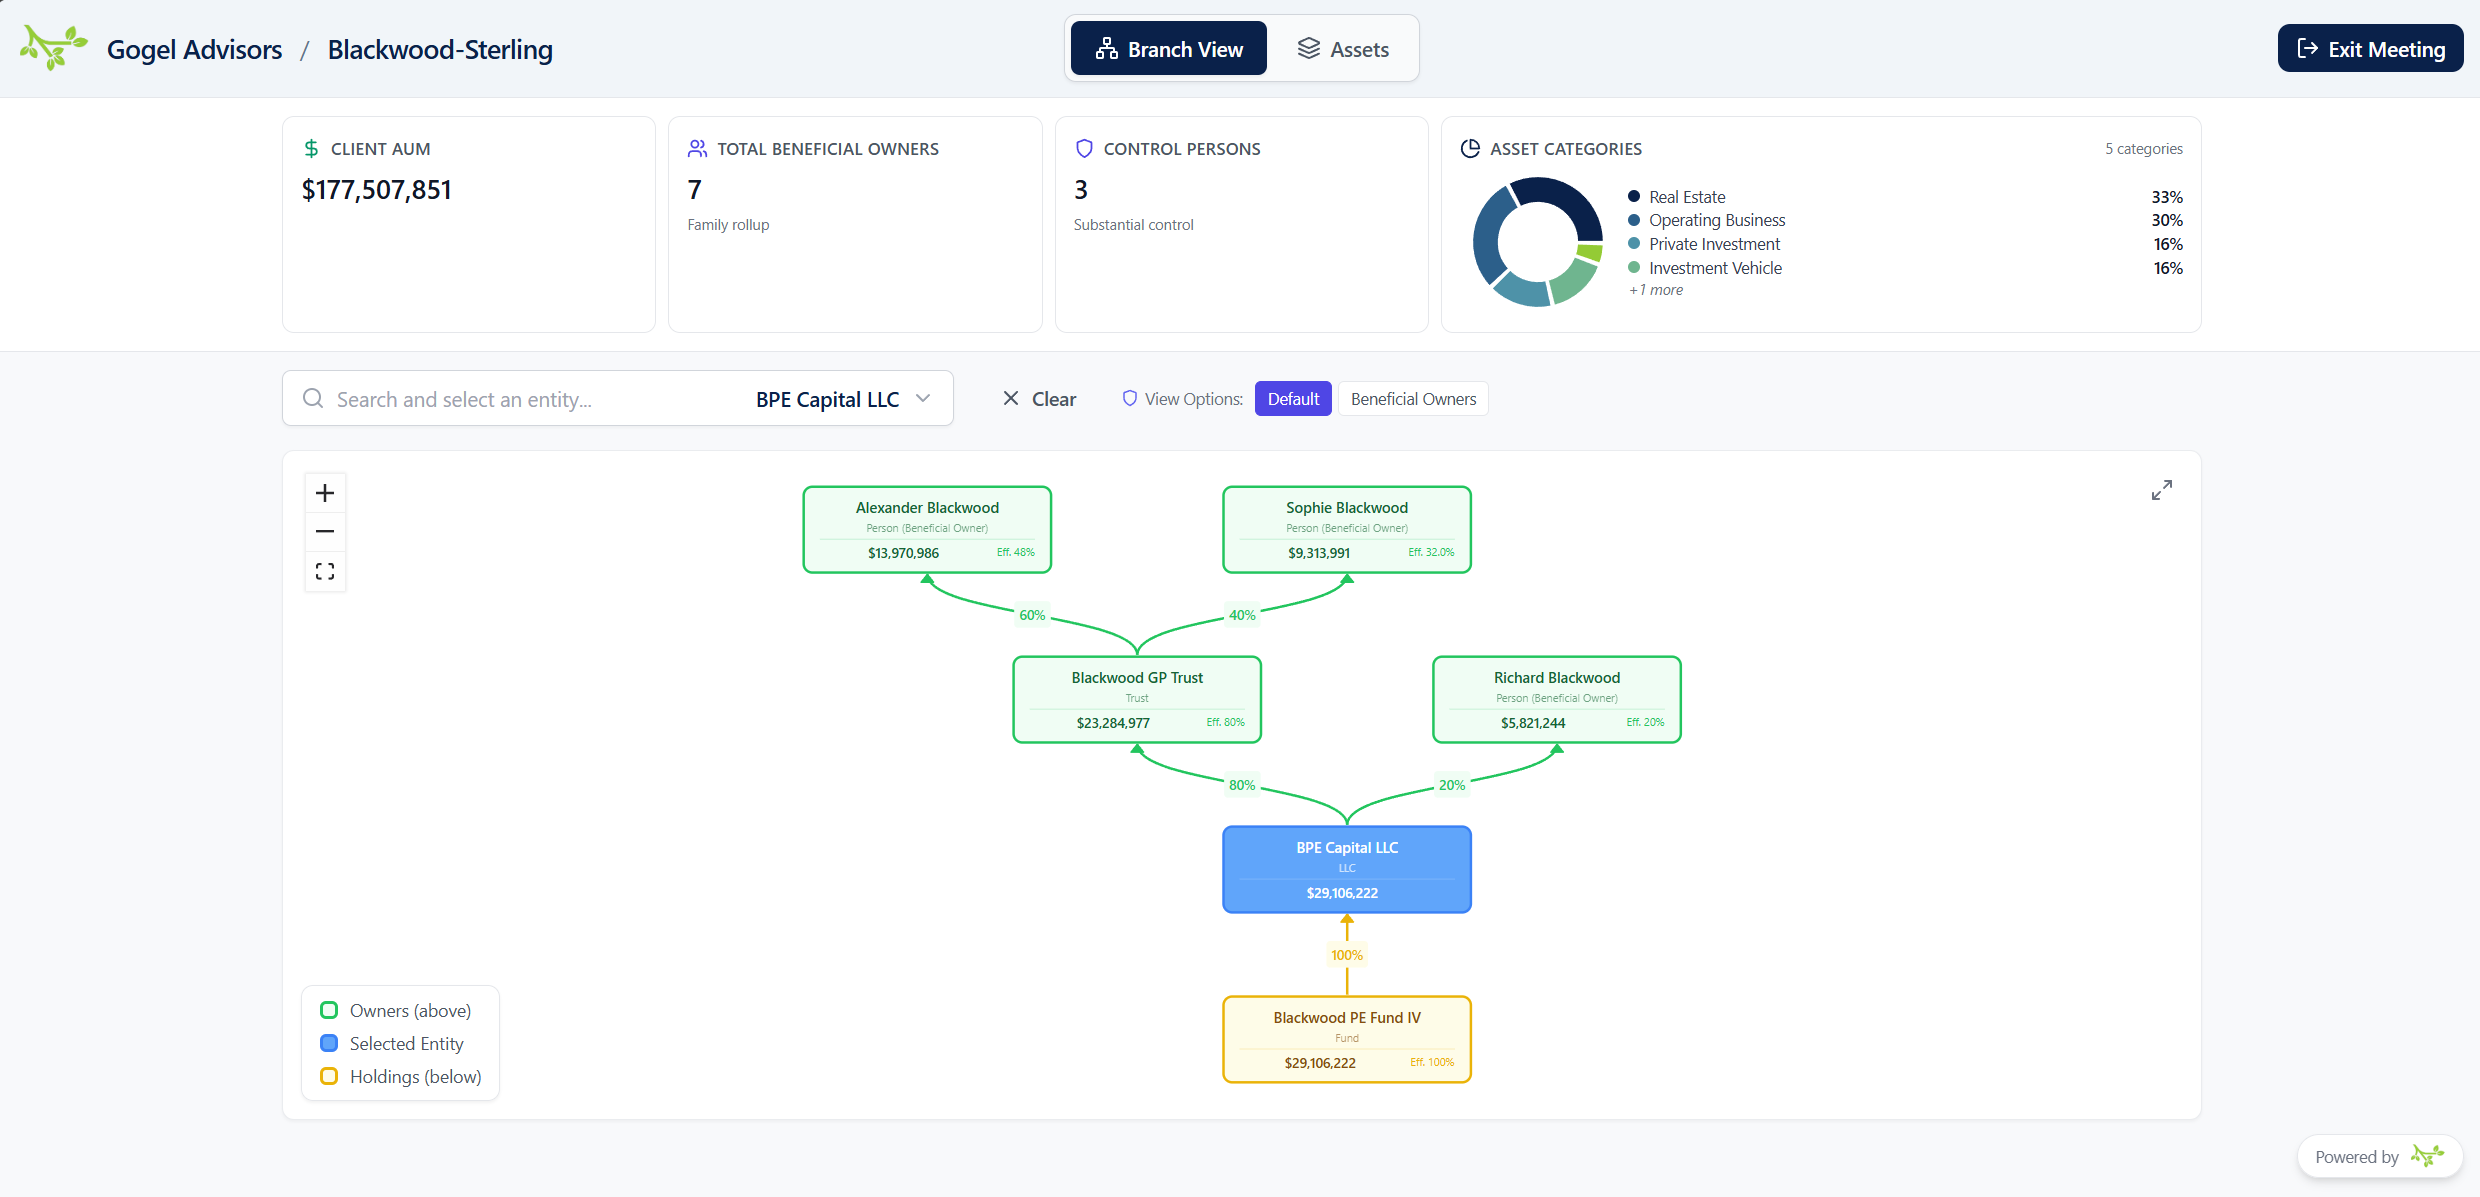
Present the structure on screen, branded with your firm’s logo — one family visible, editing locked.
Branded · on paper
One-click, presentation-ready exports for the reporting cadence your team already runs.
Self-serve · between meetings
Invite chosen owners to a firm-branded portal scoped to exactly what they own — holdings, values, and their own ownership view.
A curated view of the platform itself, branded with your firm’s logo — with the same controls your team uses internally, so no one has to learn a second system.
Branch Reporting handles the ownership math, the diagrams, and the reporting from one source of truth. Set up in weeks — designed by practitioners.